
The dashboard allows you to understand what phase of the short-term cycle the economy is in, as well as predict the likely actions of economic agents (inflation, exchange rate, business activity, rate).

According to the dashboard results for September, 18 out of 29 factors indicate an overheating of the economy. The analysis was carried out in 4 blocks: inflation, monetary, economic and external terms. A semantic analysis of the National Bank of the Republic of Kazakhstan press release was also carried out.
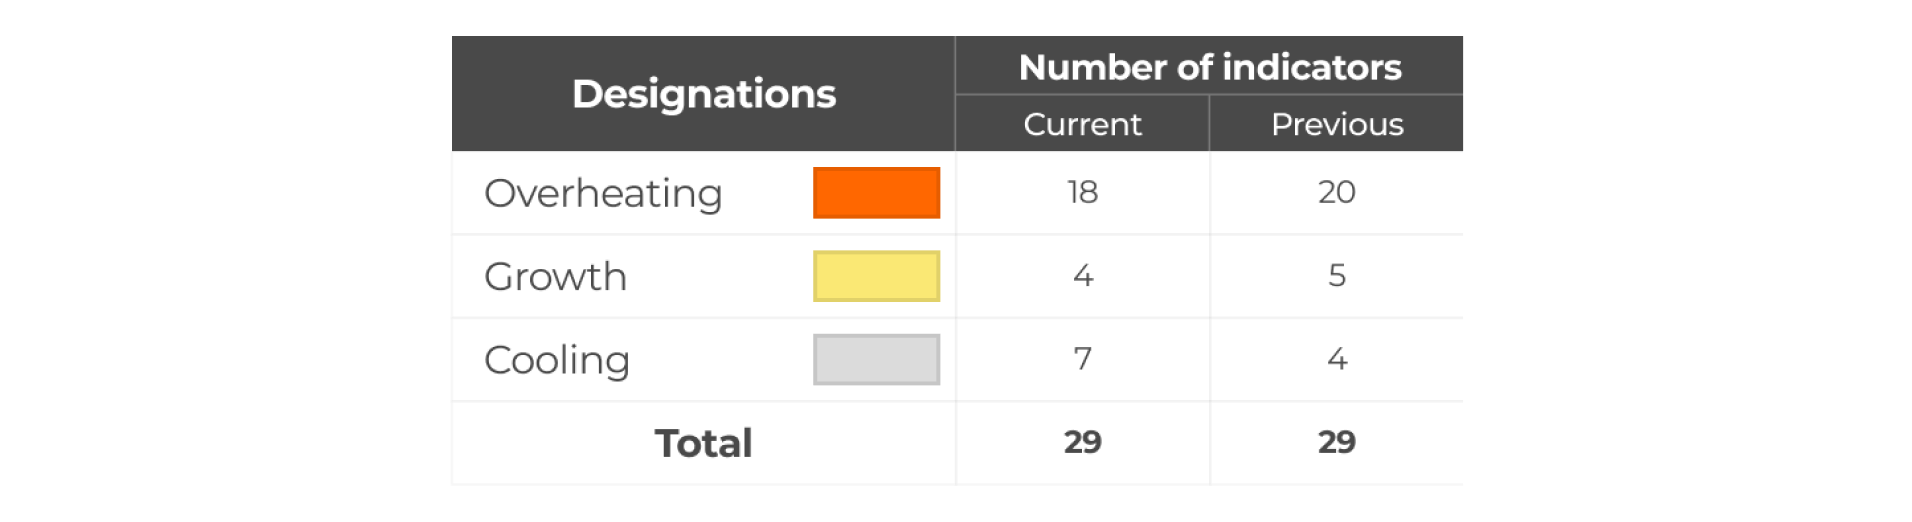
1 indicator in the inflation block and 2 in the economic conditions block have moved into the cooling zone compared to the previous dashboard. Price factors for the period under review show an increase in overheating, while indicators of business activity demonstrate cooling. Thus, there is an imbalance between supply and demand when the latter does not have time to respond to the corresponding fiscal and credit incentives. And in these conditions, it is necessary to focus on the point factors of excess demand: consumer lending and non-scalable fiscal motivation. Further monetary tightening may lead to an asymmetric and undesirable effect, when supply may shrink more, and demand does not react as appropriate.
Read more in the paper


Monthly inflation overview: causes, elements, forecasts